Audit of CS rate in NTSV: A Quality Improvement Project
Audit of CS rate in NTSV: A Quality Improvement Project
Shahela Nasir *1, Muhammad Zeeshan Rana2
1. Shahela Nasir (FCPS, MRCPI), Manchester University NHS Foundation Trust (MFT).
2. Muhammad Zeeshan Rana, Assistant professor of Pathology, Quetta institute of medical sciences (QIMS) MBBS, FCPS (Chem path), MHPE.
*Correspondence to: Shahela Nasir (FCPS, MRCPI), Manchester University NHS Foundation Trust (MFT).
Copyright
© 2024 Shahela Nasir. This is an open access article distributed under the Creative Commons Attribution License, which permits unrestricted use, distribution, and reproduction in any medium, provided the original work is properly cited.
Received: 09 October 2024
Published: 23 October 2024
Audit of CS rate in NTSV: A Quality Improvement Project
Introduction
Caesarean delivery is a life-saving procedure when medically indicated, but associated with negative impact on maternal and neonatal outcomes. Each C-delivery increases complication rates for women. Many pregnant women undergo procedures such as C-sections, repeat C-sections, and labour inductions that may not be medically indicated.
NTSV includes low risk, first time mom nulliparous, singleton (no twins) with gestational age at or beyond 37wk with vertex presentation (no breech or transverse lie) who underwent cs following either spontaneous or induced labour. By decreasing the C-section rate in this low risk population by improved quality care can lead to healthy outcomes and cost effectiveness.
Alliance for Innovation on Maternal Health states (AIM, 2022) states, “No one disputes that caesarean birth can be a lifesaving procedure, with obvious benefits to mother and baby when vaginal birth is no longer safe.The Leapfrog Group, 2015 stated that the high NTSV C-section rate and its extreme variation among hospitals serve as prime examples of a healthcare system plagued by inconsistent quality and the overuse of avoidable procedures. In addition, the Joint Commission (TJC, 2015) called the rise in caesarean “ an epidemic” and recognized “there is no data that higher rates improve any outcomes, yet the C-section rates continue to rise.”
Over the years, global CS rates have significantly increased from around 7% in 1990 to 21% today surpassing the ideal acceptable CS rate which is around 10%–15% according to the WHO (2021).These trends are projected to continue increasing over the current decade where both unmet needs and overuse are expected to coexist with the projected global rate of 29% by 2030 (Betran et al.,2021). Due to the uterine scar, the first CS carries intrinsic risk of repeat CS (RCS) in future pregnancies, justifying the Cragin’s dictum back in 1916 “once a caesarean always a caesarean”(Barber et al.,2011).
The NTSV(nulliparous term singleton vertex) caesarean delivery rate has been recognized as a meaningful benchmark. Although it is considered as a low risk population, with rising trends it contributed to overall increased caesarean section rate globally.
Caesarean birth has short-term complications, including blood loss, infection, and venous thrombosis (Bauserman et al., 2015) and long-term effects in subsequent pregnancies and births, including abnormal placentation and increased risk of haemorrhage and hysterectomy (Marshall et al.,2011).
We have to critically explore the contributing factors to reduce the rising CS rates, evaluate current practices, and implement quality improvement projects, and develop strategies that could form part of a workplace improvement plan.
Aim & Objective
The audit was conducted to identify and analyse indications for Caesarean Section in the NTSV at Prince Sultan Hospital, KSA.To reveal possible areas where clinical practice can be changed to safely reduce CS rates.
It reflects the impact on the patient and demonstrates that by reducing unnecessary CS in the NTSV population, which is the ultimate aim. Ensuring safety for both mother & baby, and improving patient expectations.
Design:
The 14 months audit is a prospective review which is conducted in the labour ward of the department of obstetrics & gynaecology at Prince Sultan Hospital from november 2021 to december 2022.
Method:
Inclusion criteria:
All nulliparous women with gestational age at or >37wk with cephalic presentation who underwent CS following either spontaneous or induced labour.
Exclusion criteria:
All nulliparous patients with abnormal lie and non-vertex presentations, preterm & multiple pregnancy.
Results
The total number of gravidas who delivered during the study period were 1952, out of which 289 (14.80%) were NTSV, among them spontaneous labour were 70.9%, induced were 13.4%, and instrumental deliveries were 12.11%. The CS among NTSV were found to be 26.9%, and vaginal deliveries were 73%. The main indications for emergency caesarean sections in NTSV were foetal distress, non-progress of labour, failed induction i.e. 57%, 28% and 7.6%, respectively. The overall CS rate was 639(32.7%), and the contribution of NTSV to the overall CS rate was 3.99%. The average cs rate is 27.60% over 14 months which is comparable to the national target goal of 26.7% in NTSV.
Interpretation of umbilical artery cord ph were normal (>7.25) in 62.2%, abnormal (<7.20) in 22.2%,and borderline (7.21-7.24) in 15.6% among CS for foetal distress.
Discussion
Haelle, 2018; Main, 2016 advocates by preventing the first unnecessary CS is critical as 90% of women who undergo a CS will have CS with subsequent births, conversely, 90% of women who giving birth vaginally will continue to have successful vaginal births.
Li, Wan & Zhu, 2021; Zhang, 2019 argues that CS prevention is also significant for newborn outcomes via increasing early breastfeeding initiation and decreasing human-milk substitute supplementation.
Globally, CS rates have risen sharply, with studies showing rates well above the 10–15% recommended by the World Health Organization (WHO) for optimal maternal and neonatal outcomes (WHO, 2015). Globally, CS rates have risen significantly over the past few decades, with substantial variation between regions. In high-income countries, including the UK, the U.S., and Australia, CS rates have consistently exceeded 30% in many settings (Betran et al., 2021). In the context of the NHS, the rising CS rates in NTSV populations represent a significant challenge. The National Institute for Health and Care Excellence (NICE) guidelines aim to promote vaginal birth in NTSV cases, yet caesarean sections remain prevalent, with the CS rate in some hospitals exceeding 30% (NHS, 2022).
In discussion, regarding the results obtained through the data collected for NTSV following observations can be highlighted.
Age Distribution:
The age distribution of patients in my data reveals the following breakdown:
<20 years: 3.8% of patients
21-30 years: 80% of patients
31-40 years: 10%
>40 years: 1.4%
This distribution highlights a predominant group within the 21-30 age range, representing the majority of patients. The smallest representation comes from the age group over 40, suggesting that younger patients are more likely to be part of the study period.
Figure 1
NTSV Delivery Rates and Caesarean Sections: Out of 1952 total deliveries, 14.8% were NTSV pregnancies. Among these, 26.9% underwent caesarean sections (CS), while the majority (73%) delivered vaginally. This CS rate is slightly higher than the national target goal of 26.7% in NTSV, suggesting that the institution is performing at a comparable level to broader national averages. Reducing the CS rate in NTSV deliveries is important for lowering unnecessary surgical risks in first-time mothers and minimising potential complications in future pregnancies, as suggested in the literature.
Figure 2, Figure 3
Mode of Delivery: Among NTSV women, 70.9% experienced spontaneous labour, while 13.4% underwent induction. Instrumental deliveries (likely including forceps or vacuum-assisted) accounted for 12.11%. This mix of delivery methods reflects standard obstetric practice, where spontaneous labour is preferred, but interventions are necessary in some cases to optimise maternal and foetal outcomes. However, the percentage of instrumental deliveries could warrant review, particularly in relation to the rates of assisted vaginal delivery vs. CS.
Figure 4
Indications for Caesarean Sections: The primary reasons for emergency CS in this group were foetal distress (57%), non-progress of labour (28%), and failed induction (7.6%). The high rate of foetal distress leading to CS aligns with the concern for foetal well-being in labour, where abnormal heart rate patterns on cardiotocography (CTG) prompt urgent surgical intervention.
Monitoring and management strategies for labour progression and induction success should be continuously reviewed to reduce unnecessary CS.
Figure 5
Umbilical Artery Cord pH: The umbilical artery cord pH, used as an indicator of foetal well-being, was found to be normal (>7.25) in 62.2% of cases, borderline (7.21-7.24) in 15.6%, and abnormal (<7.20) in 22.2% among the CS performed for foetal distress. These findings are critical as an abnormal cord pH suggests foetal acidosis and distress, justifying emergency interventions. While the majority of cases had a normal outcome, the relatively high percentage of abnormal pH readings supports the rationale for timely caesarean interventions in certain cases. However, it also raises the need to review the sensitivity and specificity of foetal monitoring methods to reduce unnecessary CS.
Overall Caesarean Section Rates: The overall CS rate in the institution was 32.7%, which includes the contribution of NTSV (3.99%). This reflects an ongoing challenge in reducing overall caesarean deliveries, a key objective in modern obstetric care to limit maternal morbidity. The World Health Organization (WHO) recommends that CS rates should ideally be below 15%, although the specific needs of each population can result in higher rates.
Figure 6
Data Snapshot: Trends of CS Rate in NTSV on Monthly Basis:
The chart illustrated the monthly trends in Cesarean Section (CS) rates among nulliparous, term, singleton, vertex (NTSV) pregnancies. It showed fluctuations in the CS rate from November 2021 to December 2022, with a peak of 46.00% in October 2022 and a low of 10% in August 2022. Other notable data points include:
November 2021 and December 2021 at around 25.80% and 26%, respectively.
The CS rate rises sharply in February 2022 to 33.30% and reaches a lower peak of 35.70% in April 2022.
June 2022 has a slightly lower rate at 30.70%, but the figure increases significantly in October 2022.
These variations suggest that there are factors influencing CS rates on a monthly basis, which could involve clinical protocols, patient demographics, or other hospital practices.
Figure 7
Conclusion
The rising CS rate in NTSV populations presents a significant challenge to maternity care systems globally and within the NHS. By critically analysing current practices and drawing on quality improvement models such as Donabedian’s framework and the PDSA (Plan, Do Study, Act) cycle, it is clear that a multifaceted approach is needed to reduce unnecessary caesarean sections.
A reduction in NTSV caesarean delivery rate may have a substantial impact on health care. Hospitals can implement quality improvement initiatives to decrease NTSV caesarean delivery rate by provider education, provider feedback, and promoting institutional policies that support vaginal birth where appropriate.
The literature review regarding different quality improvement (QI) projects to reduce effective CS Rate in NTSV low risk population suggested evidence-based practice, care bundles that address labour dystocia, promoting institutional guidelines and auditing data and feedback.
In the future, telemedicine and digital health platforms could support better labour management by offering real-time consultations and second opinions, helping to avoid unnecessary caesarean sections. Additionally, the development of artificial intelligence (AI) tools that predict labour progression and identify women at risk for complications could support more tailored care and reduce the likelihood of caesarean delivery.
References
1. Alliance for Innovation on Maternal Health (AIM), 2022. Safe reduction of primary caesarean birth. Alliance for Innovation on Maternal Health. Accessed August 15, 2022, from https://saferbirth.org/psbs/safe-reduction-of-primary-cesarean-birth/
2. The Leapfrog Group, 2015. Report: Variation in NTSV c-section rates among California hospitals. The Leapfrog Group. Accessed August 16, 2022, from https://www.leapfroggroup.org/sites/default/files/Files/PBGH_NTSV-C-Section-Variation-Report. Pdf
3. Joint Commission, 2015. Specifications manual for Joint Commission national quality core measures (v2015A): PC-02 NTSV caesarean section. Accessed February 7, 2016, from https://manual.jointcommission.org/releases/TJC2015A/MIF0167.html
4.World Health Organization (WHO), 2021. Caesarean section rates continue to rise, amid growing inequalities in access. Accessed June 16, 2021, from https://www.who.int/news/item/16-06-2021-caesarean-section-rates-continue-to-rise-amid-growi Ng-inequalities-in-access.
5. Betran, A.P., Ye, J., Moller, A.B., Souza, J.P. & Zhang, J., 2021. Trends and projections of caesarean section rates: global and regional estimates. BMJ Global Health, 6(6), p.e005671. Barber, E.L., Lundsberg, L.S., Belanger, K., Pettker, C.M., Funai, E.F. & Illuzzi, J.L., 2011.
Indications contributing to the increasing caesarean delivery rate. Obstetrics & Gynecology, 118, pp.29-38.
6. Bauserman, M., Lokangaka, A., Thorsten, V., Tshefu, A., Goudar, S.S., Esamai, F. et al., 2015. Risk factors for maternal death and trends in maternal mortality in low- and middle-income countries: a prospective longitudinal cohort analysis. Reproductive Health, 12(suppl 2), p.S5.
7. Marshall, N.E., Fu, R. & Guise, J.M., 2011. Impact of multiple caesarean deliveries on maternal morbidity: a systematic review. American Journal of Obstetrics and Gynecology, 205, pp.262.e1-262.e8.
8. Haelle, T., 2018. Your biggest c-section risk may be your hospital. Consumer Reports. Available at: https://www.consumerreports.org/c-section/biggest-c-section-risk-may-be-your-hospital/ [Accessed 14 Sep. 2024].
9. Main, E., 2016. Safely reducing primary caesarean birth. [video webinar] Produced by E. Main. Li, L., Wan, W. & Zhu, C., 2021. Breastfeeding after a caesarean section: A literature review. Midwifery, 103, p.103117. doi: 10.1016/j.midw.2021.103117.
10. Zhang, F., Cheng, J., Yan, S., Wu, H. & Bai, T., 2019. Early feeding behaviours and breastfeeding after the caesarean section. Breastfeeding Medicine, 14(5), pp.325-333. doi: 10.1089/bfm.2018.0150.
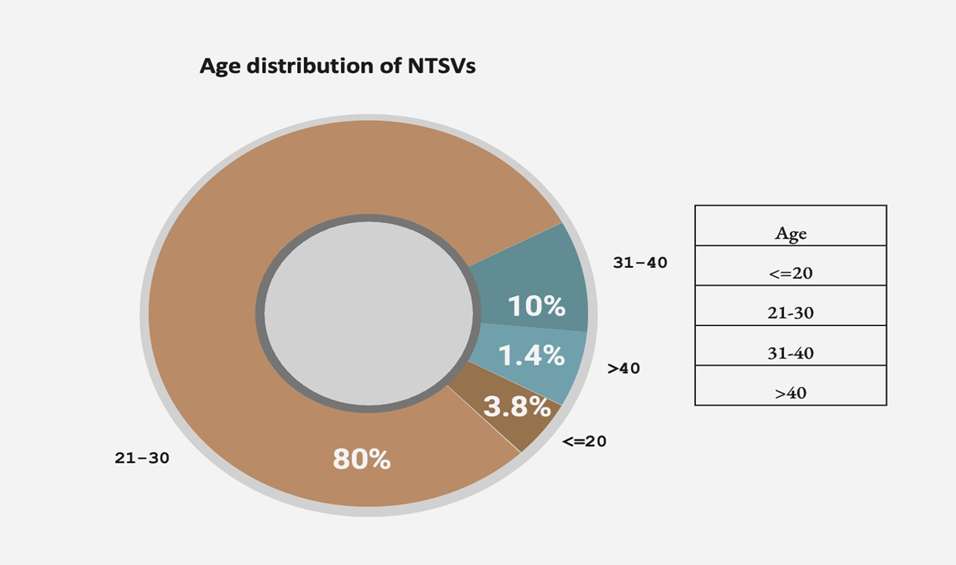
Figure 1
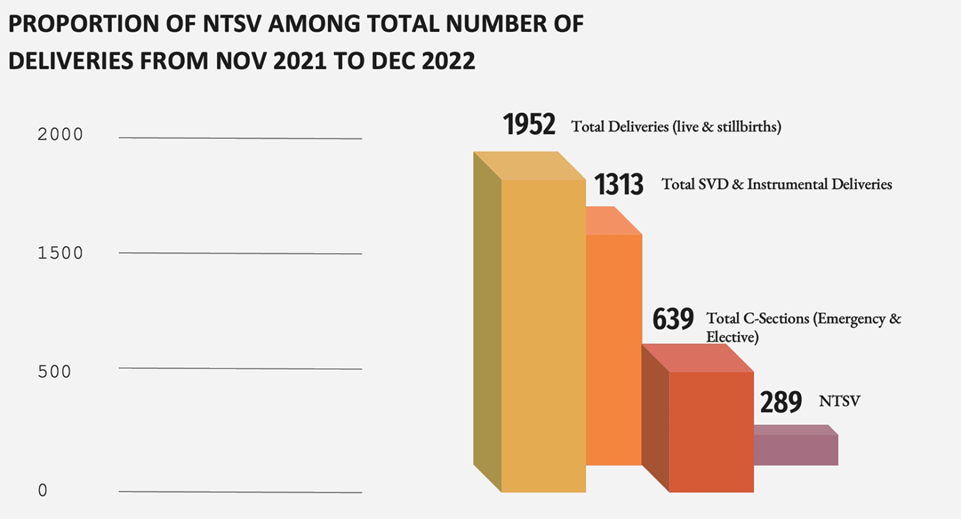
Figure 2
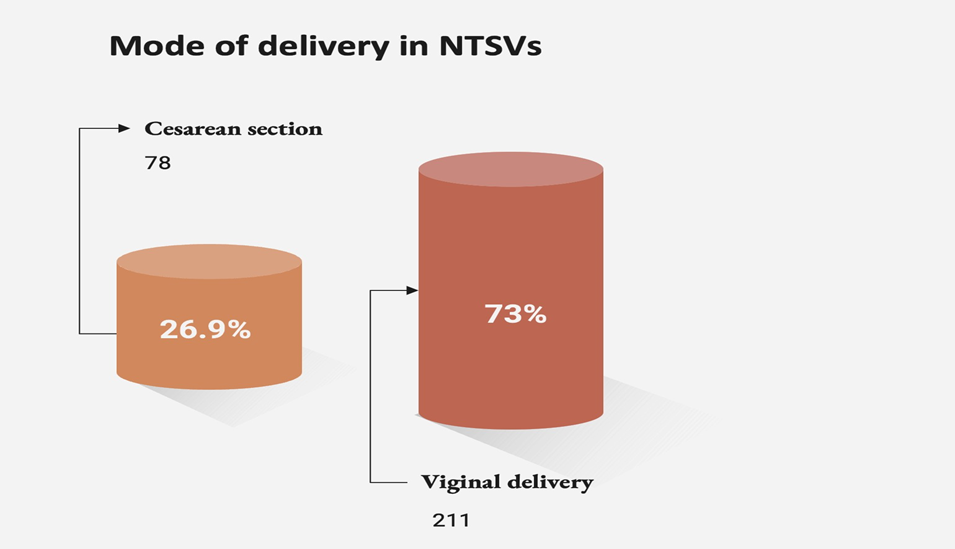
Figure 3
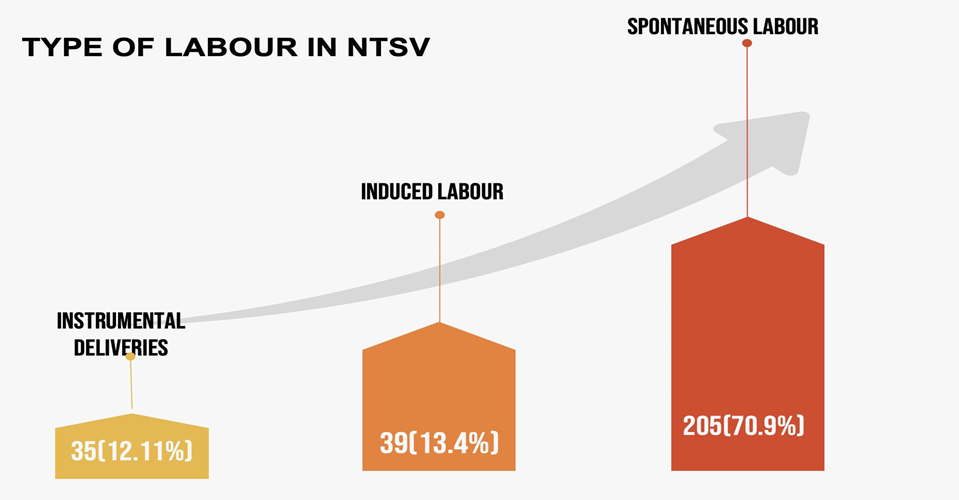
Figure 4
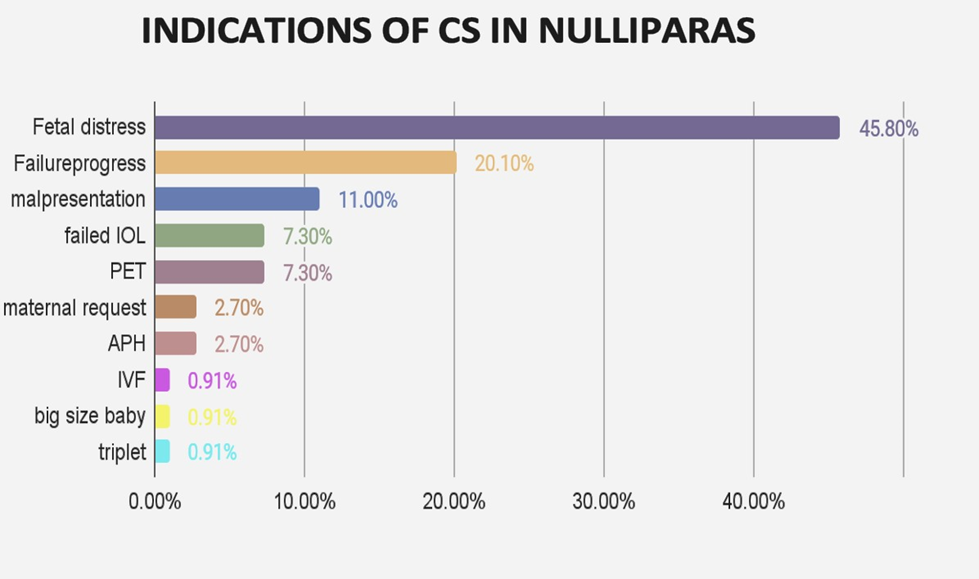
Figure 5
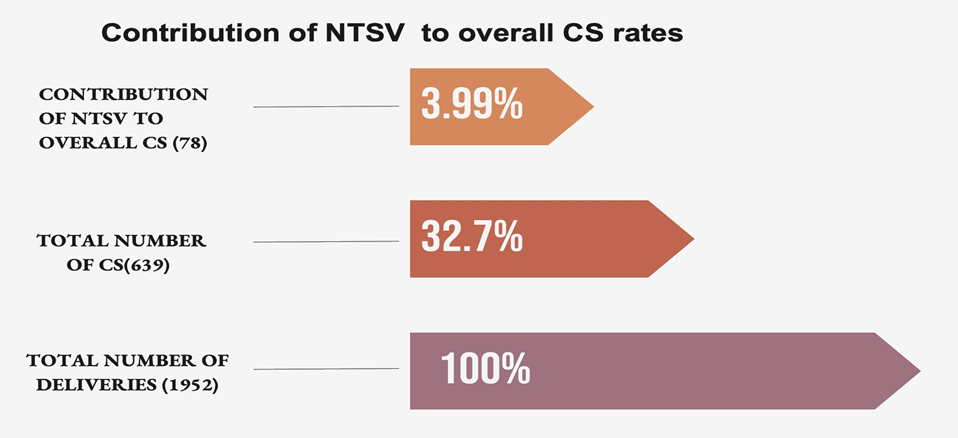
Figure 6
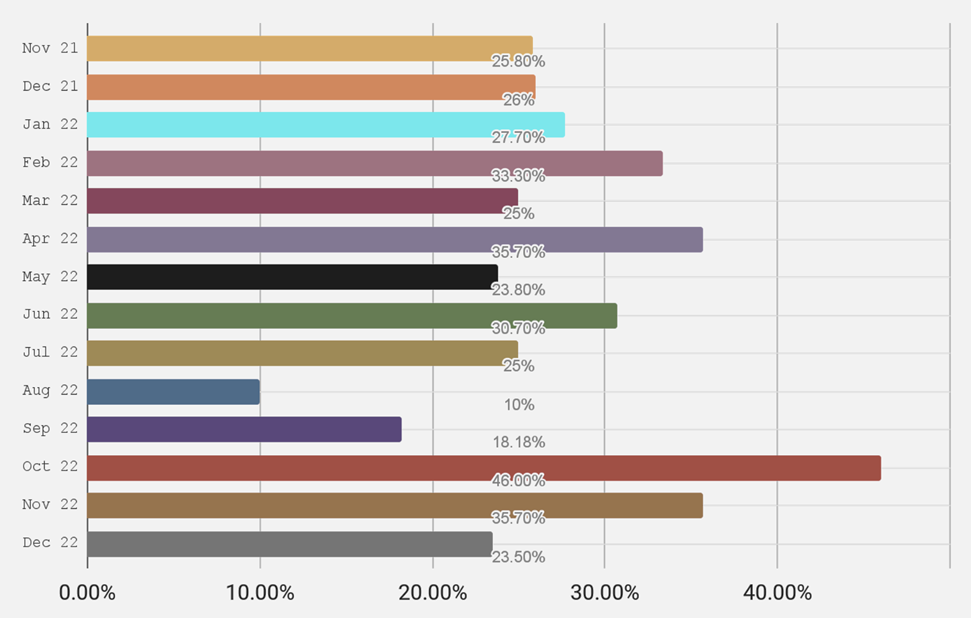
Figure 7
