A Study to Assess the Effectiveness of Self Instructional Module on Knowledge Regarding Improving the Appetite of Cancer Patients Undergoing Chemotherapy among Staff Nurses in Selected Hospitals of Jaipur.
A Study to Assess the Effectiveness of Self Instructional Module on Knowledge Regarding Improving the Appetite of Cancer Patients Undergoing Chemotherapy among Staff Nurses in Selected Hospitals of Jaipur.
Sunil Kumar *
*Correspondence to: Sunil Kumar, Principal Investigator, Asst. Manager Nursing Homi Bhabha Cancer Hospital & Research Centre, Punjab (A Unit of TATA Memorial Centre, Mumbai).
Copyright.
© 2025 Sunil Kumar. This is an open access article distributed under the Creative Commons Attribution License, which permits unrestricted use, distribution, and reproduction in any medium, provided the original work is properly cited.
Received: 21 December 2024
Published: 08 January 2025
A Study to Assess the Effectiveness of Self Instructional Module on Knowledge Regarding Improving the Appetite of Cancer Patients Undergoing Chemotherapy among Staff Nurses in Selected Hospitals of Jaipur.
INTRODUCTION
“The doctor of the future will no longer treat the human frame with drugs, but rather will cure and prevent disease with nutrition.”
-Thomas Edison
Cancer is a disease process whereby cells proliferate abnormally, ignoring growth-regulating signals in the environment surrounding the cells. The WHO and the International Agency on Cancer states that the global impact of cancer in terms of bare numbers is six million deaths a year, and something like double in terms of incidence and the human impact is much more to express. In 2008, approximately 12.7 million cancers were diagnose (excluding non-melanoma skin cancers and other non-invasive cancers), and in 2010 nearly 7.98 million people died.[152] Cancers as a group account for approximately 13% of all deaths each year with the most common being: lung cancer (1.4 million deaths), stomach cancer (740,000 deaths), liver cancer (700,000 deaths), colorectal cancer (610,000 deaths), and breast cancer (460,000 deaths). This makes invasive cancer the leading cause of death in the developed world and the second leading cause of death in the developing world. Over half of cases occur in the developing world. Changes in appetite are common with cancer and cancer treatment. People with poor appetite or appetite loss may eat less than usual, not feel hungry at all, or feel full after eating only a small amount. Ongoing appetite loss may lead to weight loss, not getting the nutrients from food that the body needs, and loss of muscle mass and strength, all of which are serious complications. The combination of weight loss and muscle mass loss is called cachexia or wasting.
NEED OF THE STUDY:
Cancer is a disease process whereby cells proliferate abnormally, ignoring growth-regulating signals in the environment surrounding the cells. The WHO and the International Agency on Cancer states that the global impact of cancer in terms of bare numbers is six million deaths a year, and something like double in terms of incidence and the human impact is much more to express
According to WHO report, the cancer rate could further increase by 50%, 15 million new cases in the year of 2020 mainly due to steadily ageing population in both developed countries and developing countries and also the current trends in smoking prevalence and the growing adoption to unhealthy lifestyles. In the year 2000, malignant tumors were responsible for 12% of the nearly 56million deaths worldwide from all causes. The three leading causes of death in cancer are lung (17.8%), stomach (10.4%) and liver (8.4%)
RESEARCH HYPOTHESIS:
All hypotheses will be tested at 0.05 level of significance
H0: There is no significant difference between pre test and post test knowledge score of staff nurses and selected demographic variables.
H1: There will be a significant difference between pre test and post test knowledge scores of staff nurses and selected demographic variables.
SAMPLE SIZE
The sample size was 60 staff nurses working in different Hospital, Jaipur groups participate in the research study married group.
Fig 7
FIG-1: PIE DIAGRAM SHOWING PERCENTAGE DISTRIBUTION OF STAFF NURSES ACCORDING TO AGE
From the table II & figure 1, the pie diagram shows the distributions of Staff Nurses according to age. 30.0% respondents were belongs to the age group of 20-25 years, 23.30% Respondents were belongs to the age group of between 26-30 years, 26.70% was found in the age group of between 31-35 years, 15.00% respondents were belongs to the age group of between 36-40 years, 5.0% respondents were belongs to the age group of between Above 40 years The maximum participant in the research study from the age group of 30-25 years.
FIG-2: BAR DIAGRAM SHOWING THE DISTRIBUTION OF STAFF NURSES ACCORDING TO GENDER.
From the table II & figure 2, the bar diagram give the gender status of samples. 40.00% (24) of respondents were the male, and 60.0% (36) of respondents were the Female staff nurses who participated in the study.
FIG-3: PIE DIAGRAM SHOWING THE DISTRIBUTION OF STAFF NURSES ACCORDIND TO BY RELIGION STATUS
From the table II & figure 3, the pie diagram gives Religion Status of Staff Nurses working in Selected Hospitals at Jaipur who have participate in the study. 56.70% of respondents were the Hindu, 8.3% of respondents were the Christian, 8.3% of respondents were the Muslim , 6.70% of respondents were the Sikh and 20.0 of respondents were the Other.
FIG-4: SHOWING DISTRIBUTION OF STAFF NURSES ACCORDING TO THE TYPES OF BASIC NURSING PREPARATION
The table II & figure 4, the bar diagram shows the Types of Basic Nursing Preparation of Staff Nurses working in Selected Hospitals at Jaipur. 33.30% of respondents were the GNM, 38.30% of respondents were the B.Sc., 18.3% of respondents were the P.B.Bsc. and 10.0% of respondents were the M.Sc.
FIG-5: PIE DIAGRAM SHOWING THE DISTRIBUTION OF STAFF NURSES WITH CHEMOTHERAPY BY YEARS OF NURSING EXPERIENCE
The table II & figure 5, the pie diagram gives the Years of Nursing Experience of Staff Nurses working in Selected Hospitals at Jaipur. 43.30% of respondents were the between 0-5 years, 33.30% (20) of respondents were the between 6-10years, 13.30% of respondents were the between 11-15 years and 10.0% of respondents were the between above 15 years.
FIG-6: THE BAR DIAGRAM SHOWING DISTRIBUTION OF STAFF NURSES ACCORDING TO THE MARITAL STAUTS
From the table II & figure 6, the bar diagram is showing the Marital Status distribution. It shows that 51.70% of respondents were the Married, 15.00% of respondents were the Unmarried, 15.00% of respondents were the Divorced and 18.3% of respondents were the Widow.
SUMMARY
This chapter dealt with the methodology undertaken for the study. It includes research approach, research design, setting of the study, variables, population, sample & sampling technique, description and interpretation of tools, pilot study, data collection procedure and plan for data analysis.
References
1. Motzer RJ, Tannir NM, McDermott DF, et al. Nivolumab plus Ipilimumab versus Sunitinib in Advanced Renal-Cell Carcinoma. N Engl J Med. 2018;378(14):1277-1290.
2. Jo S, Won T, Daoud A, ?iháková D. Immune checkpoint inhibitors associated cardiovascular immune- related adverse events. Front Immunol. 2024;15:1394123. 136(21):2085-2087.
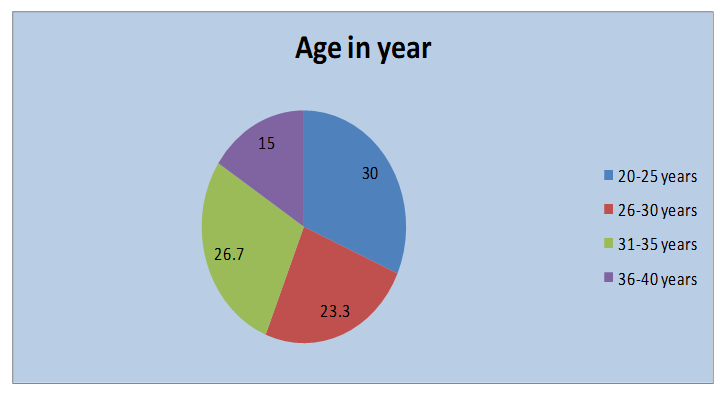
Figure 1
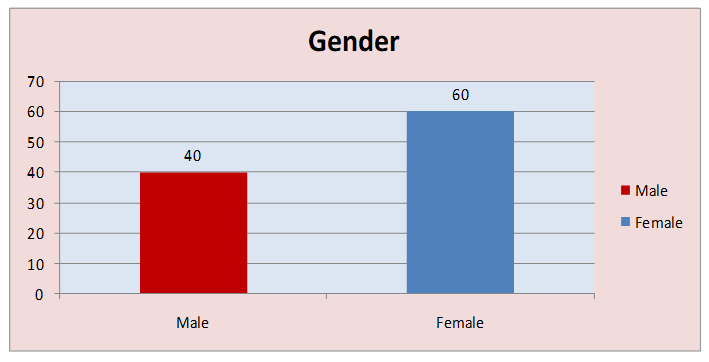
Figure 2

Figure 3
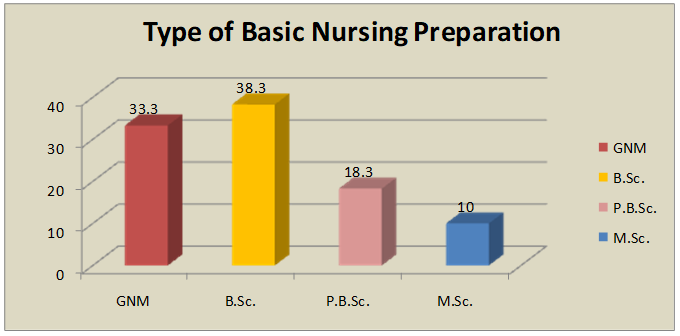
Figure 4
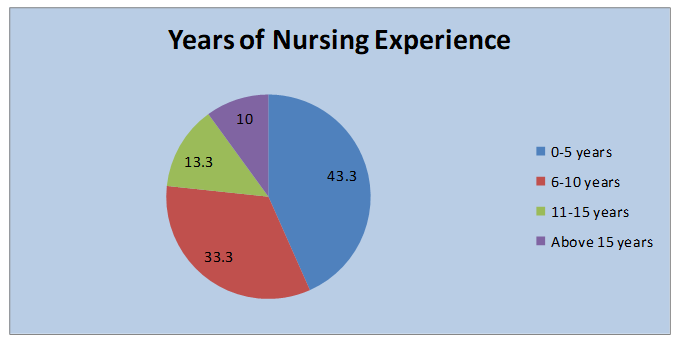
Figure 5

Figure 6

Figure 7